Analytics and AI-assisted diagnosis
Combine operating, vibration, alarm and maintenance data to support diagnosis and maintenance decisions.
 Wind Engineering Services
DASHENG TECHNOLOGY
Combine operating, vibration, alarm and maintenance data to support diagnosis and maintenance decisions.
Configure computing resources, analytical models and turbine knowledge bases for traceable data assets.
Structure, system principles and troubleshooting
CMS retrofits, hybrid-tower and blade monitoring
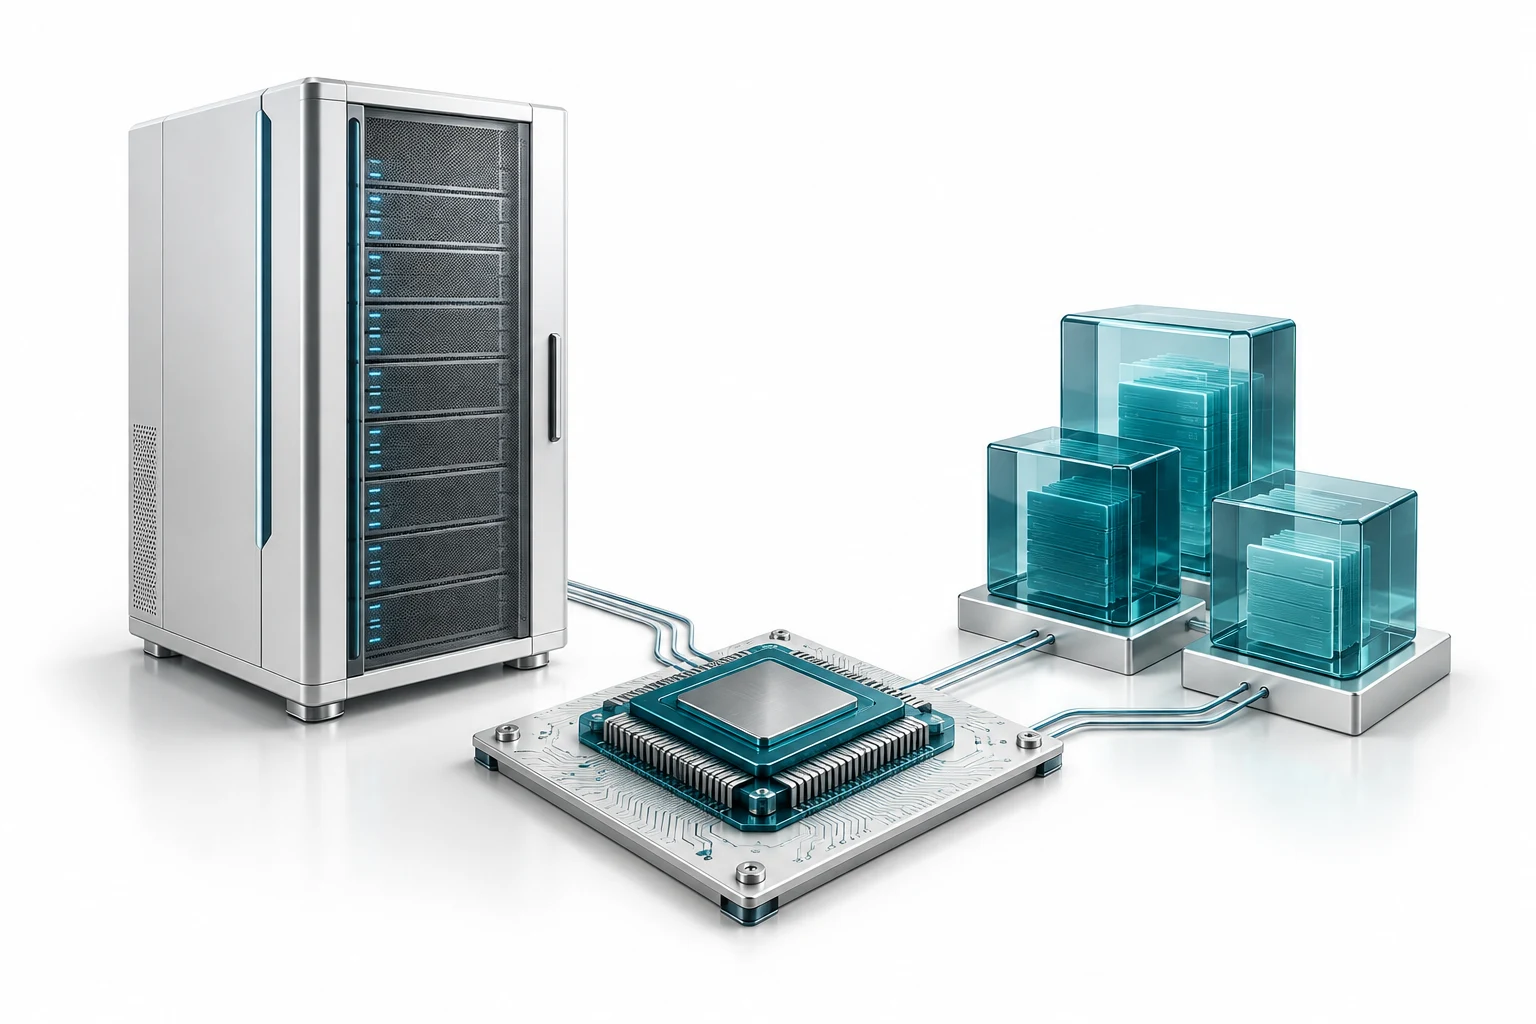
Coverage, energy, availability and loss accounting establish priorities
Connect wind sensing, yaw/pitch, converter and control evidence to field checks
Use vibration and operating conditions to investigate bearings, gearbox, generator, cooling and hydraulics
| Metric group | Definitions and scope | Management and action |
|---|---|---|
| Coverage and operating state | State the analysis period, valid turbine-hours and missing data. Report outages, curtailment, low wind and dispatch separately. | Define the comparable turbine set and retain every exclusion. |
| Energy and full-load hours | Check meter boundary and capacity. Full-load hours = energy / capacity. Compare performance only under matched conditions. | Separate resource, operating-limit and equipment effects. |
| Availability and reliability | State the availability denominator and exclusions. Group outage records into events before counting duration and recurrence. | Prioritize long and recurring outages; alarm messages are not fault events. |
| Loss attribution and action status | Estimate energy loss against a validated baseline. Separate curtailment, dispatch, low wind and equipment factors. | Maintain a loss ledger, verification tasks and a retest plan; keep attribution open until verified. |
Framework only. State period, sample level, coverage and denominator. Time availability does not determine energy-loss rate.
| System | Analysis focus | Verification and remediation |
|---|---|---|
| Wind sensing and performance | Check wind-speed and direction validity. Screen power deviations under comparable wind, curtailment and operating conditions. | Verify the measurement chain and wind effects before investigating control limits or performance decline. |
| Yaw and pitch | Review yaw commands, drive and hydraulic response. Link pitch demand and feedback with pressure, pump duty and lubrication records. | Check alignment reference, braking and actuators. Distinguish hydraulic and electric pitch configurations. |
| Converter, control and sensors | Analyze thermal behavior, trips and resets. Check sensor drift, communication and controller parameter versions. | Validate sensing and parameter baselines. Use logs to identify repeat triggers, then plan changes and regression tests. |
Power curves support screening. Check sensing, controls and operating conditions. Alarm timing alone is not causality; missing evidence precludes a conclusion.
| System | Condition analysis | Action and verification |
|---|---|---|
| Main bearing and gearbox | Match speed, load and ambient temperature. Combine thermal residuals, vibration, oil analysis and replacement history. | Distinguish measurement bias, lubrication/cooling issues and candidate mechanical defects. Prioritize field checks and maintenance. |
| Generator and cooling | Compare bearing and winding temperatures with load, vibration, cooling-fan operation and alarm duration. | Inspect sensing, airflow, heat rejection and lubrication. Retest under comparable conditions and track recurrence. |
| Hydraulics, lubrication and structure | Review pressure recovery and retention, pump duty, oil/grease delivery and actuator feedback. Link structural signals with inspections. | Use evidence to check leakage, seals, accumulators and blockages. Record actions, configuration and retest results. |
Candidates are not diagnoses. Missing current vibration, oil or inspection evidence precludes a conclusion; past work orders do not verify current outcomes.
Case and application
The supplied chart lists 18 turbine-to-mast deviations; investigate measurement conditions before interpreting them
Check sectors, mast obstruction, nacelle transfer behavior and instrument calibration
| Rank / group | Relative deviation |
|---|---|
| 1 | -13.47 |
| 2 | -12.96 |
| 3 | -10.29 |
| 4 | -9.28 |
| 5 | -8.4 |
| 6 | -7.66 |
| 7 | -6.71 |
| 8 | -6.64 |
| 9 | -6.62 |
| 10 | -6.04 |
| 11 | -5.84 |
| 12 | -5.79 |
| 13 | -4.72 |
| 14 | -4.54 |
| 15 | -4.12 |
| 16 | 0.96 |
| 17 | 1.78 |
| 18 | 4.65 |
18 turbines; per-turbine summaries; sampling period unspecified
Redrawn from supplied summaries. Sampling period, filters and calibration are incomplete; differences do not establish faults or returns.
Case and application
Export values and nominal frequencies; no fault or health verdict.
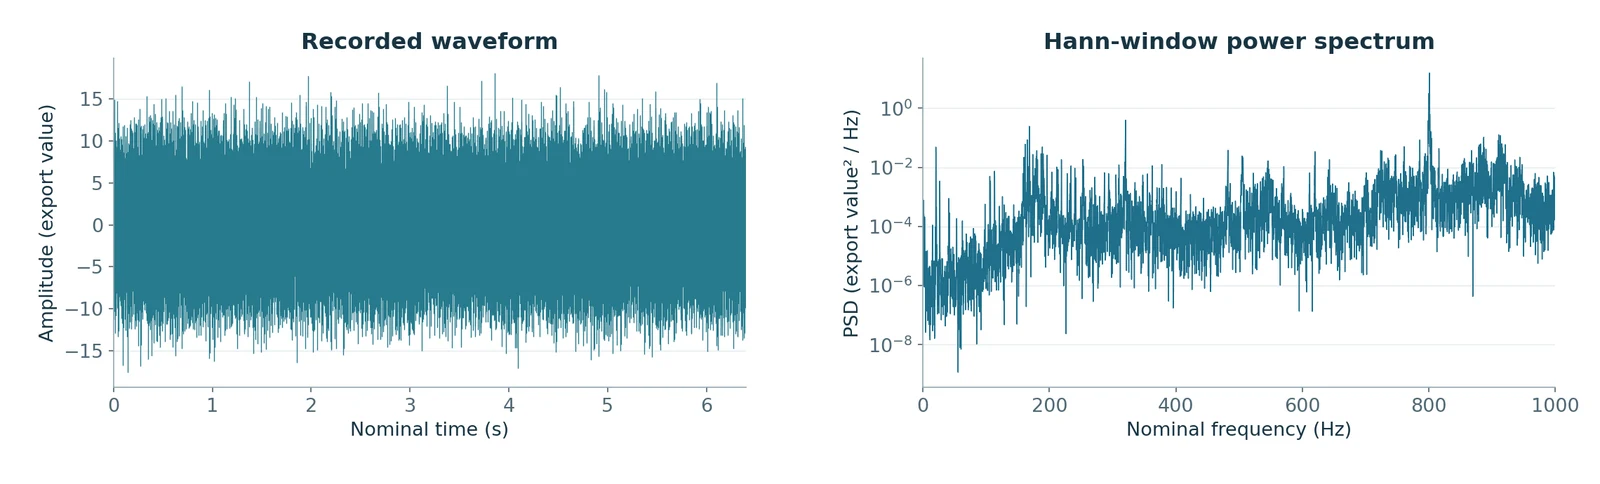
Measured export record; export-value amplitudes and nominal frequencies. No fault or health diagnosis is claimed.
3 binned curves, 6–8 m/s
Compare yaw deviation with normalized power. Curve differences do not directly specify a parameter correction.
Check vane zero, nacelle direction, sectors and wind conditions; verify alignment with independent measurements.
If independent measurements confirm an offset, develop a turbine-specific correction. Otherwise retain it for investigation.
Supplied aggregates. Raw sampling, filtering, calibration and independence not reproduced; full sampling window not supplied.
3 turbines, 5 measurement records
One turbine has an initial measurement and two retests; two others have one each. Five records represent three turbines.
Check measurement location, load state, reference and uncertainty, together with blade installation angles and vibration.
If the applicable turbine acceptance criteria are exceeded, review installation and zeroing. Use the specific technical specification.
Supplied aggregates. Raw sampling, filtering, calibration and independence not reproduced; full sampling window not supplied.
Source case explorer ↗Translate condition, recurring-fault and maintenance questions into reviewable analytical tasks
Organize data by turbine, system, component and measurement point, linked to applicable drawings, alarms, work orders and configuration
Assist retrieval, explanation and reporting; retain sources, limits and open checks for engineering review

Define users, decisions and deliverables; map turbines, systems, components and measurement points
Connect operating, vibration, alarm and maintenance data; check units, time, configuration and sources
Build matched-condition analysis and mechanism checks; turn evidence and open questions into reviewable action options
Test the analysis chain using cases and field feedback; record versions, applicability and post-maintenance checks
Guanlan development example; functions, interfaces and acceptance scope are agreed per project.
Method overview ↗Digital models represent the turbine, pitch system, converter and operating environment for teaching, scenario exploration and fault training.
Connect a physical main-control PLC to real-time models through I/O and communication interfaces for closed-loop testing of interfaces, control logic and injected faults.
Select models, controllers and test scenarios for training or engineering validation. Physical pitch rigs and converter controllers are separately scoped extensions.
Study digital startup, grid connection, generation and shutdown. Explain how wind, speed, pitch, torque and power interact.
Check I/O, units and timing. Inject sensor, communication or interlock faults. Learners test hypotheses and verify recovery.
Retain curves, events and actions. Assess essential checks, action sequence and reasoning. AI assists review; instructors approve scores.
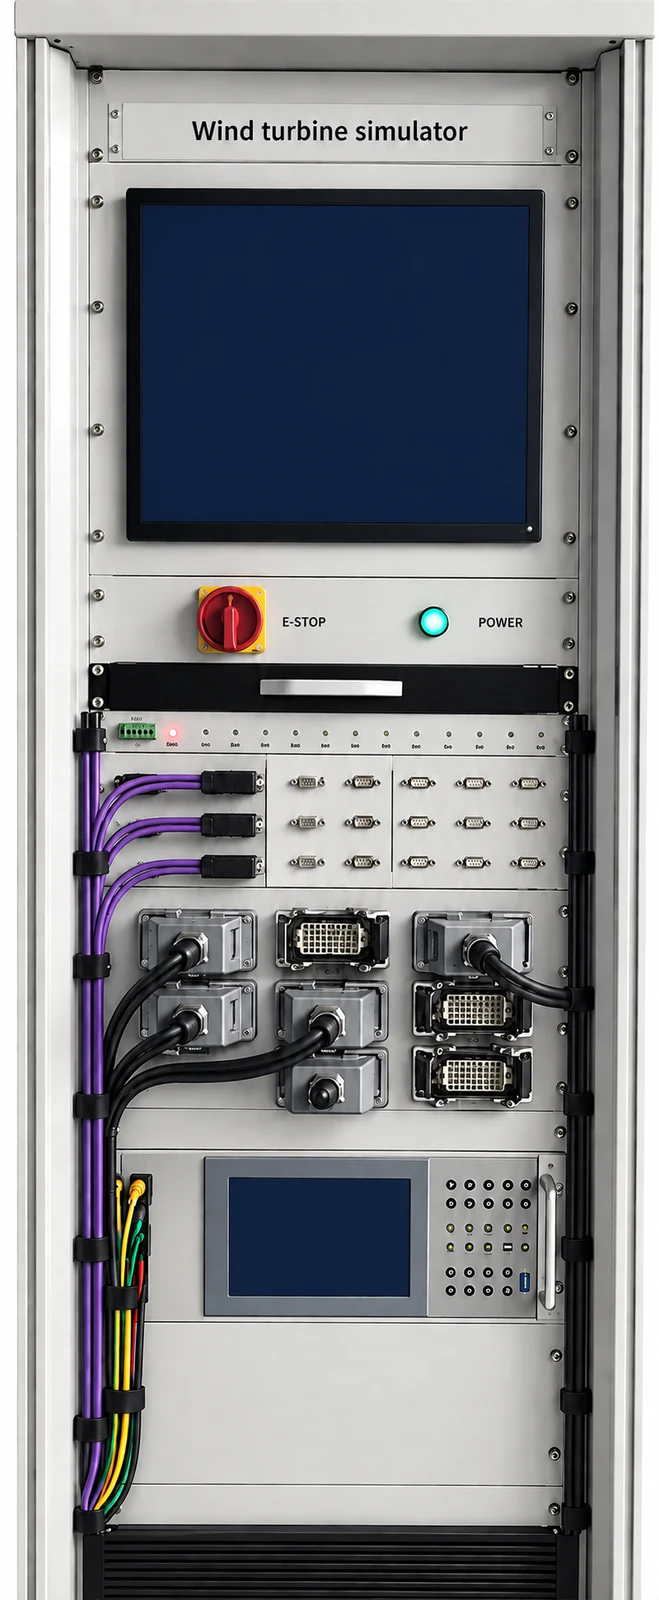
Training concept: a physical main-control PLC with digital plant models. Scope and acceptance are project-specific. Learning outcomes require assessment.
Test DI/DO, analog, PT100, Profibus and SSI interfaces. Integrate safety-chain, yaw, hydraulic and startup/grid-connection logic.
In maintenance mode, establish pressure, then command partial depressurization. Log pump and pressure signals; check sequence, target and reset.
The report case uses about 150 to 35 bar. Retain versions, injections and traces. Do not transfer these settings directly to other turbine models.
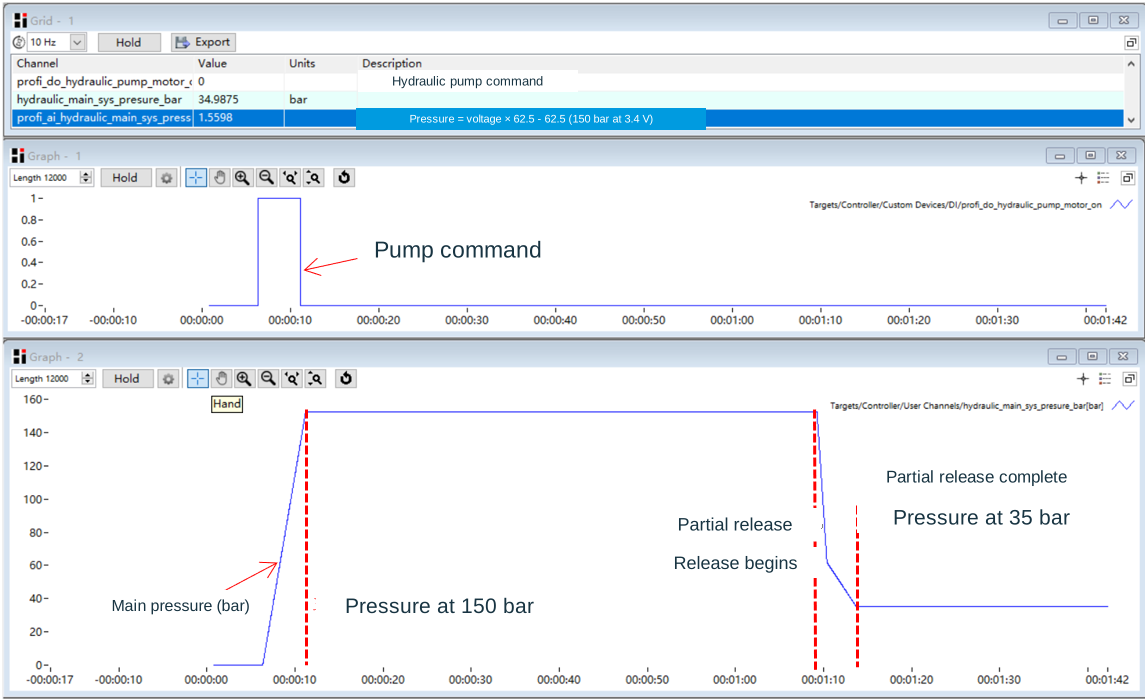
Supplied test report, pp.22, 32–34. Simplified model with accelerated settings, not field data. Reference only; no Dasheng delivery or universal acceptance claim.
Assess CMS sensors, acquisition and analytics for integration and upgrades
Configure continuous monitoring for deformation, vibration and connections
Select sensing and verification methods for specific damage and operating issues
System design and alert capability depend on turbine type, installation and field validation
CONTACT
Talk to us about O&M, repairs, digital solutions and inspection equipment.
Business enquiries
zhuo.wu@ds-techcn.com+86 152 3118 3837Beijing headquarters